DS9 scripting using Python subprocesses
During my master's thesis (Gupta et. el. 2024, submitted to A&A) work at the European Southern Observatory (ESO), I worked on searching for stellar clusters in the Milky Way using whole GLIMPSE data, so, naturally I required three color images of a lot of objects and from different infrared surveys (2MASS, WISE, Spitzer). To do this one by one was one heck of a problem, especially when you have 100s of sources. A good solution is go to IRSA website and download the images one by one but for how long? An automated or at least semi-automated process is indeed required. I found a new way to fetch the images by using a new python module called pyESASky and this was introduced to me by Marcos Lopez (ESA/ESAC, Madrid) in the SciOPs conference on AI, 2022 held at European Southern Observatory HQ in Garching. But the website was still a bit experimental and there is problem with minimum size of images which could be fetched and it certainly doesn't match my requirements. So, I decided to do this the traditional way using IRSA servers to fetch fits files and use DS9 to make three color images. Umm.. the main problem still exists though. But... anything can be scripted as long as you don't have to prove yourself "not as robot". Although, pyds9 exists, I could not find an operational version (:/). So, I decided to combine python subprocesses and DS9 to automatically generate three color images.
The idea is to download all the fits files from IRSA by passing a list of coordinates and saving it. I'd suggest not to fetch more than 100 images at once as the website is a bit slow. After you have a zip file dowloaded to a folder, just unzip it and you'll see folders with named ra+dec (ex. 293.711682+20.625794 or 293.711682+20.625794) and with raw fits images (ex. 2mass_j, 2mass_h, 2mass_k) with systematic naming (a big shoutout to IRSA DB managers here). Now, let's get on point to run the python subprocesses to run DS9. I have collected the commands from DS9's website: DS9 Commands
Interesting note: DS9 is named after Star Trek series Deep Space 9.
Load packages:
                        import pandas as pd
                        from decimal import Decimal
                        import subprocess
                        import time
                        import matplotlib.pyplot as plt
                        from astropy.coordinates import SkyCoord
                        from astropy import units as u
                        from PIL import Image
pip installation: pip install pandas matplotlib astropy pillow
Install matplotlib only for visualization using Python.
Main script:
                aprg = pd.read_csv('C:/Users/akash/Downloads/APRG_All-part1/coords.csv')

                for i in range(aprg.shape[0]):

                    radec = "%f" % (aprg['ra'][i]) + "%+f" % (aprg['dec'][i])  # due to filename
                    print(i / aprg.shape[0])
                    ds9 = subprocess.Popen('C:\SAOImageDS9\ds9.exe \
                                          -rgb -fits \
                                          C:/Users/akash/Downloads/APRG_All-part1/' + radec + '/fc_' + radec + '_spitzer_seipirac4(2.4)_reproj.fits -scale ZScale \
                                          -rgb channel green -fits \
                                          C:/Users/akash/Downloads/APRG_All-part1/' + radec + '/fc_' + radec + '_spitzer_seipirac2(2.4)_reproj.fits -scale ZScale \
                                          -rgb channel blue -fits \
                                         C:/Users/akash/Downloads/APRG_All-part1/' + radec + '/fc_' + radec + '_spitzer_seipirac1(2.4)_reproj.fits \
                                          -scale ZScale -zoom to fit -colorbar no \
                                          -export C:/Users/akash/Desktop/MIROCLS/Three_Color_Images/GLIMPSE/' + radec + '_glimpse.jpeg 100')

                    time.sleep(5.0)
                    ds9.terminate()

                    ds9 = subprocess.Popen('C:\SAOImageDS9\ds9.exe \
                                          -rgb -fits \
                                          C:/Users/akash/Downloads/APRG_All-part1/' + radec + '/fc_' + radec + '_wise_4_reproj.fits -scale ZScale \
                                          -rgb channel green -fits \
                                          C:/Users/akash/Downloads/APRG_All-part1/' + radec + '/fc_' + radec + '_wise_2_reproj.fits -scale ZScale \
                                          -rgb channel blue -fits \
                                         C:/Users/akash/Downloads/APRG_All-part1/' + radec + '/fc_' + radec + '_wise_1_reproj.fits \
                                          -scale ZScale -zoom to fit -colorbar no \
                                          -export C:/Users/akash/Desktop/MIROCLS/Three_Color_Images/WISE/' + radec + '_wise.jpeg 100')

                    time.sleep(5.0)
                    ds9.terminate()

                    ds9 = subprocess.Popen('C:\SAOImageDS9\ds9.exe \
                                          -rgb -fits \
                                          C:/Users/akash/Downloads/APRG_All-part1/' + radec + '/fc_' + radec + '_2mass_k_reproj.fits -scale ZScale \
                                          -rgb channel green -fits \
                                          C:/Users/akash/Downloads/APRG_All-part1/' + radec + '/fc_' + radec + '_2mass_h_reproj.fits -scale ZScale \
                                          -rgb channel blue -fits \
                                         C:/Users/akash/Downloads/APRG_All-part1/' + radec + '/fc_' + radec + '_2mass_j_reproj.fits \
                                          -scale ZScale -zoom to fit -colorbar no \
                                          -export C:/Users/akash/Desktop/MIROCLS/Three_Color_Images/2MASS/' + radec + '_2mass.jpeg 100')

                    time.sleep(5.0)
                    ds9.terminate()
I have created three instances of ds9 scripting in Spitzer, WISE and 2MASS respectively. As you can see all of them use same chain
of commands except for the filenames ofc. I have my coordinates (ra, dec) and radius of the region in a datafile. I uploaded it to
IRSA Finder Chart and it gave me zipped file with a file format fc_ra+dec_2mass_k_reproj.fits (similarly for Spitzer/IRAC and WISE).
Since the outfiles are names something like ..210.32+55.46_2m...fits or ..210.32-55.46_2m...fits, we use initial list with a string
formatting "%f" % (aprg['ra'][i]) + "%+f" % (aprg['dec'][i]) to ensure smooth readability of all the files.
Subprocess works just like opening ds9, select rgb, fits, and load images, select scales, color, etc.
Visualization (optional, adjust according to your need):
Forgive me for writing a shit script for visualization.
                    #####################
                    # GLIMPSE data plot #
                    #####################

                    fig, ax = plt.subplots(4, 5, figsize=(25, 20))
                    for i in range(aprg.shape[0]):
                        size = 150 / 3600
                        ra, dec = aprg['ra'][i], aprg['dec'][i]
                        ra, dec = round(Decimal(ra), 6), round(Decimal(dec), 6)
                        radec = "%f" % (aprg['ra'][i]) + "%+f" % (aprg['dec'][i])
                        gc = SkyCoord(ra=ra * u.degree, dec=dec * u.degree, frame='fk5', unit='deg')
                        l, b = gc.galactic.l.value, gc.galactic.b.value

                        img = Image.open('C:/Users/akash/Desktop/MIROCLS/Three_Color_Images/GLIMPSE/' + radec + '_glimpse.jpeg')
                        j = i + 1
                        if i < 5:
                            ax[0, i].imshow(img, extent=(l - size * 0.5, l + size * 0.5, b - 0.5 * size, b + 0.5 * size))
                            ax[0, i].set_title('APRG %d' % j + ' (%0.4f' % l + ', %0.4f)' % b, fontsize=15)
                        elif 5 <= i < 10:
                            ax[1, i - 5].imshow(img, extent=(l - size * 0.5, l + size * 0.5, b - 0.5 * size, b + 0.5 * size))
                            ax[1, i - 5].set_title('APRG %d' % j + ' (%0.4f' % l + ', %0.4f)' % b, fontsize=15)
                        elif 10 <= i < 15:
                            ax[2, i - 10].imshow(img, extent=(l - size * 0.5, l + size * 0.5, b - 0.5 * size, b + 0.5 * size))
                            ax[2, i - 10].set_title('APRG %d' % j + ' (%0.4f' % l + ', %0.4f)' % b, fontsize=15)
                        elif 15 <= i < 20:
                            ax[3, i - 15].imshow(img, extent=(l - size * 0.5, l + size * 0.5, b - 0.5 * size, b + 0.5 * size))
                            ax[3, i - 15].set_title('APRG %d' % j + ' (%0.4f' % l + ', %0.4f)' % b, fontsize=15)
                        elif 20 <= i < 25:
                            ax[4, i - 20].imshow(img, extent=(l - size * 0.5, l + size * 0.5, b - 0.5 * size, b + 0.5 * size))
                            ax[4, i - 20].set_title('APRG %d' % j + ' (%0.4f' % l + ', %0.4f)' % b, fontsize=15)
                    plt.tight_layout()
                    plt.savefig("C:/Users/akash/Desktop/MIROCLS/Three_Color_Images/GLIMPSE_APRG.pdf")
                    plt.show()
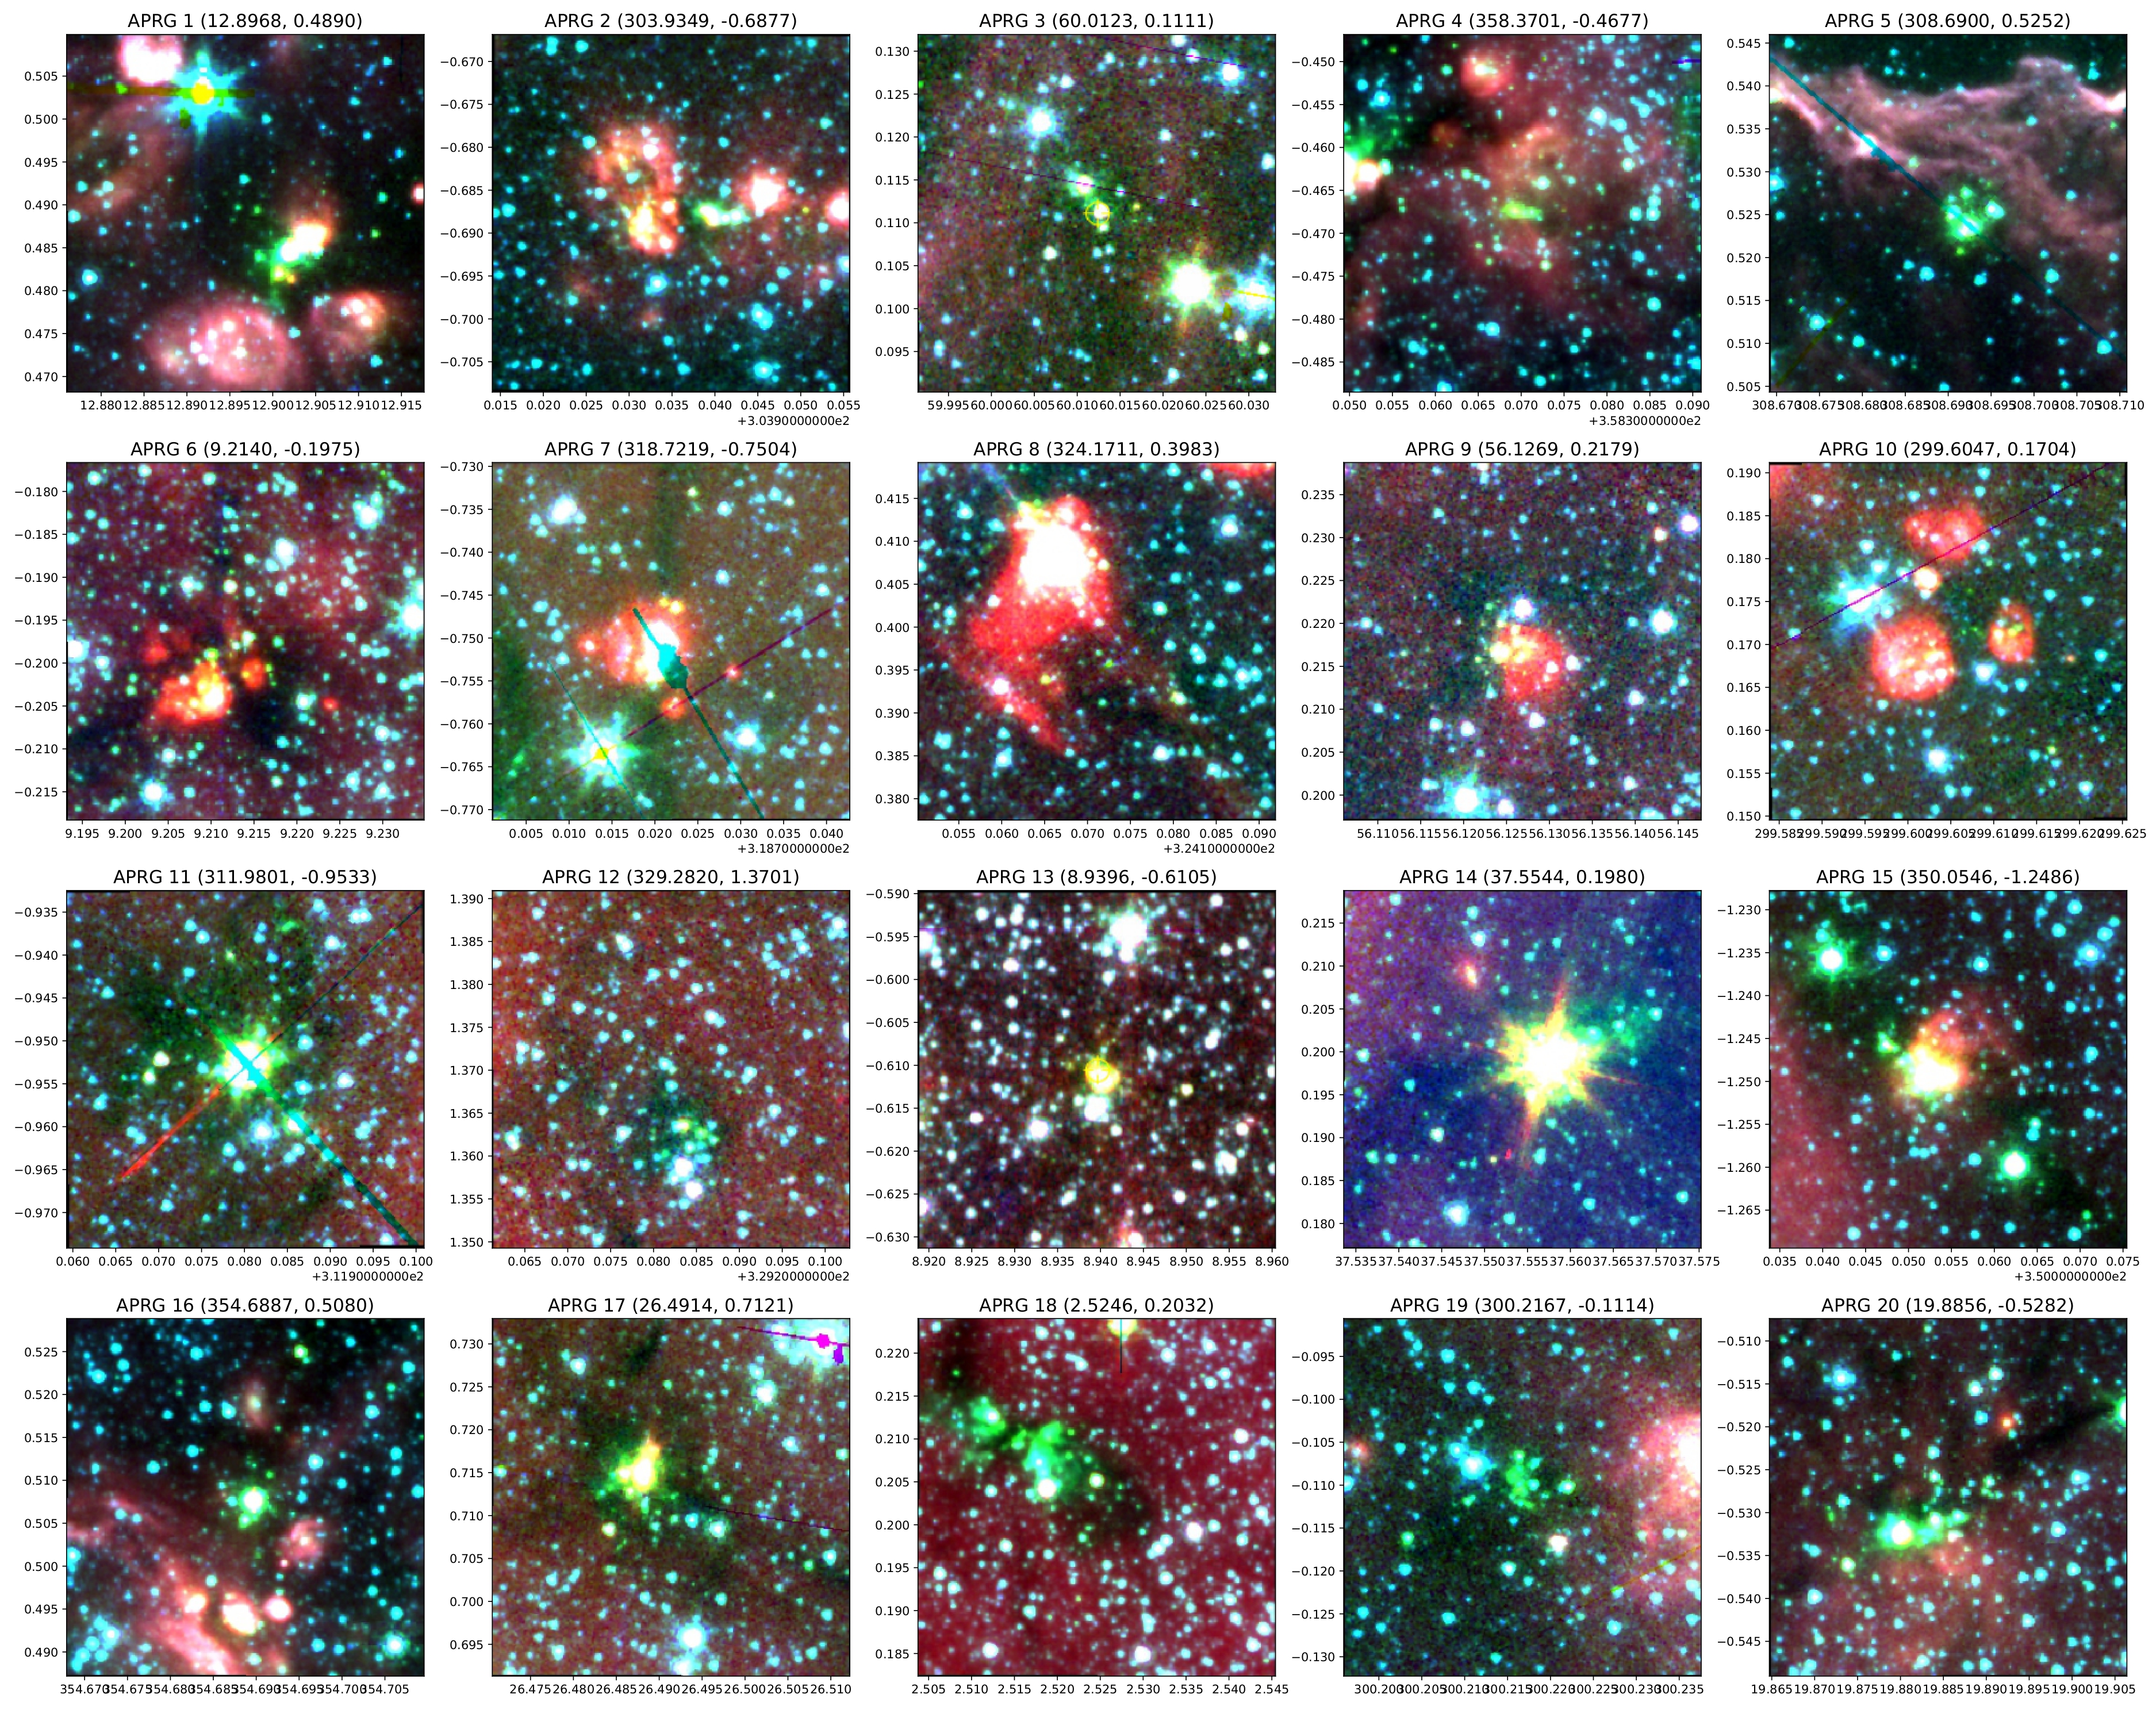
Stacked Spitzer Images from the code:
All coordinates in Galactic Coordinate System.